🌲 WINDWURF – Storm Damage Detection in Swiss Forests
WINDWURF is an interactive tool to rapidly assess storm damage in Swiss forests using openly available Sentinel-2 satellite imagery provided via the swisstopo swissEO S2-SR Product. Developed during Data Hackdays Bern 2025, this project helps the Amt für Wald und Naturgefahren (AWN) get timely insight into storm-related forest disturbances over 180,000 hectares of woodland — an area too vast for field inspection alone.
🪵 Why WINDWURF?
With storms intensifying over the last 50 years, detecting forest damage efficiently is critical for mitigation, logging decisions, and ecological monitoring. WINDWURF empowers authorities with a scalable, transparent, and reproducible approach to disaster response
Challenge
Wetteraufzeichnungen zeigen, dass die Anzahl und Heftigkeit von Stürmen in den letzten 50 Jahren zugenommen haben. Ungefähr alle 10 Jahre ist mit einem bis zwei starken Stürmen zu rechnen, die teilweise gravierende Schäden am Wald verursachen. Fernerkundungsdaten – z. B. Bilder der Erdoberfläche, die durch Satelliten gewonnen wurden – können ein effizientes Hilfsmittel sein, um rasch eine Übersicht über die Schadflächen zu erhalten.
Nach einem Sturmereignis ist das Amt für Wald und Naturgefahren (AWN) darauf angewiesen, möglichst rasch einen Überblick über die räumliche Verteilung und das Ausmass der entstandenen Schäden zu gewinnen. Bei einer Waldfläche von rund 180’000 ha (~ ⅓ Kantonsfläche resp. 3 x Fläche des Genfersees) ist es unmöglich, diese Information zeitnah vor Ort im Feld zu erheben.
Ein Werkzeug (Code), welches die online verfügbaren Sentinel-Daten anbindet und für einen gewünschten Zeitraum und räumlichen Ausschnitt die potenziellen Schad- resp. Windwurfflächen ausgibt. Vorzugsweise – aber nicht zwingend – werden Python oder R dafür verwendet (keine proprietäre Software).
References
👥 Team & Acknowledgments
Developed at Data Hackdays Bern with support from:
-
Swisstopo – Harmonized Sentinel-2 data - Tschoun,davidoesch
-
Amt für Wald und Naturgefahren (AWN) – Challenge owner nnjae, Dani Steinberger
-
Swiss Federal Office for the Environment (BAFU) -expert guidance Rdataflow, Yannick Barton
-
Eidg. Forschungsanstalt WSL and swisstopo – expert guidance and SAR Wrestling Marius Rüetschi
-
BFH Institut Public Sector Transformation - FullStack! holdan-8
🌲 WINDWURF – Storm Damage Detection in Swiss Forests
WINDWURF is an interactive tool to rapidly assess storm damage in Swiss forests using openly available Sentinel-2 satellite imagery provided via the swisstopo swissEO S2-SR Product. Developed during Data Hackdays Bern 2025, this project helps the Amt für Wald und Naturgefahren (AWN) get timely insight into storm-related forest disturbances over 180,000 hectares of woodland — an area too vast for field inspection alone.
-> Visit the WebApp : WINDWURF
🪵 Why WINDWURF?
With storms intensifying over the last 50 years, detecting forest damage efficiently is critical for mitigation, logging decisions, and ecological monitoring. WINDWURF empowers authorities with a scalable, transparent, and reproducible approach to disaster response.
🚀 What It Does
After a storm event, WINDWURF allows users to
-
Select a date of a storm event
-
Automatically get potential forest damage by compare satellite imagery before and after the event
-
Highlight forest areas with significant vegetation loss (potential storm damage)
The result: a fast, data-driven overview of potentially affected forest regions.
🛰️ How It Works
WINDWURF is powered by Google Earth Engine (GEE) and utilizes Sentinel-2 imagery provided by swissEO S2-SR processed with a pixel-wise dNBR (delta Normalized Burn Ratio) analysis. Core Analysis Steps:
NBR Calculation:

    NBR = (B8A - B11) / (B8A + B11)

    Computed for pre- and post-storm periods

dNBR Calculation:

    dNBR = NBR_post - NBR_pre

    Significant vegetation loss → low dNBR values (≤ -0.15)

Filtering & Masking:

    [Swiss-harmonized Sentinel-2 data](https://www.swisstopo.admin.ch/de/satellitenbilder-swisseo-s2-sr)

    Forest-only mask (Swiss BAFU ecosystem data)[https://www.wsl.ch/de/projekte/lebensraumkarte-schweiz-1/]

    Custom 10m cloud (CloudScorePlus) and terrain (swissSURFACE3D) and shadow masks

    Snow masking using NDSI
Outputs:
 Median NBR before and after the event

 dNBR layer showing vegetation change

 Disturbance mask (dNBR ≤ -0.15) highlighting severe impact zones
Tech Stack
 Google Earth Engine (data analysis & visualization)

 Sentinel-2 imagery (via [swissEO S2-SR](https://www.swisstopo.admin.ch/de/satellitenbilder-swisseo-s2-sr))

 Forest & snow masking (Swiss federal data)

 React frontend (using Lovable)
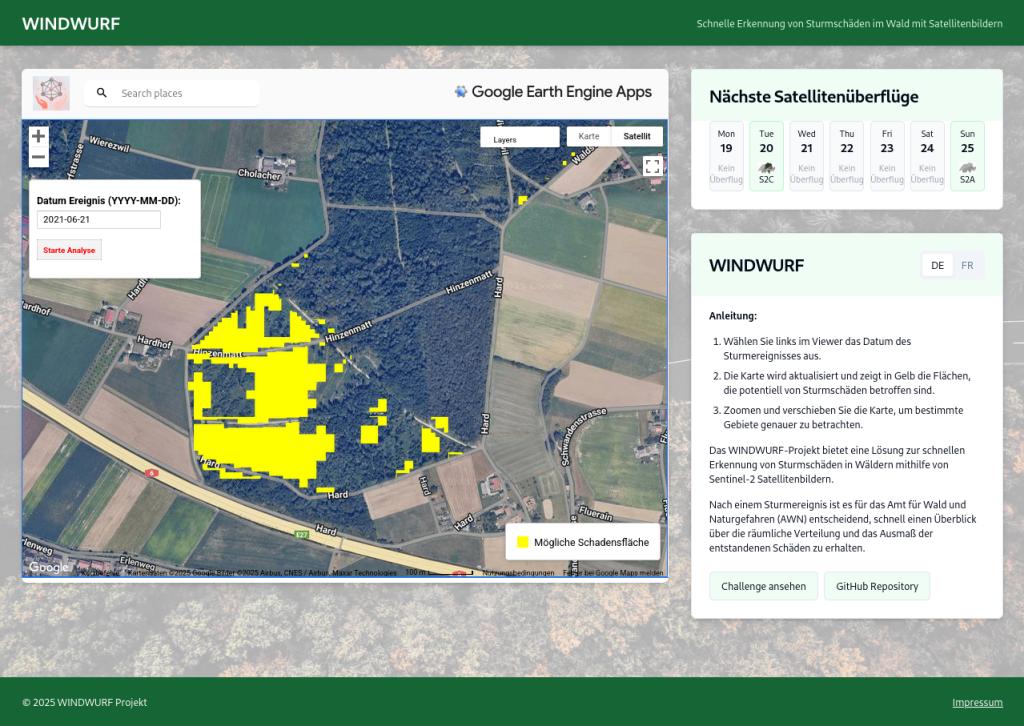
App Usage
Visit the App and follow these steps:
Wählen Sie das Datum des Sturmereignisses .

Die Karte wird automatisch aktualisiert. Gelbe Flächen zeigen potentielle Sturmschäden.

Zoomen und verschieben Sie die Karte für eine genauere Ansicht.
📊 Legend
Color Meaning 🟡 Potential forest damage (dNBR ≤ -0.15)
📅 Notes
60-day comparison window post-storm

Compared to same window from previous year

Only forests are analyzed

Disturbance areas appear in yellow on delta map

Works best in Summer, not good during wintertime
📁 File Structure (Important Components)
gee_nbr_app.js — GEE script with NBR logic, cloud/snow masking
Next Steps & Future Development
The WINDWURF project has established a solid foundation for storm damage detection in Swiss forests, but several enhancements could further increase its value for forest management:
Quantitative Analysis Features
- Area Measurement Tool: Implement functionality to calculate the total affected area in hectares for selected regions
- Economic Impact Assessment: Develop an algorithm to estimate financial damage (CHF) based on:
- Average timber value per hectare
- Severity of damage (using# dNBR thresholds)
- Forest type classification
Quantitative Analysis Features
Historical Analysis
- Storm Event Database: Create a pulldown menu of historical storm events in Switzerland
- Temporal Comparison: Enable comparison between current and past storm impacts on the same forest areas
- Long-term Trend Analysis: Visualize changing patterns of storm vulnerability across decades
Quantitative Analysis Features
Enhanced Visualization
- Damage Severity Classification: Implement a multi-level classification system beyond binary damage detection
- 3D Visualization: Integrate with swissSURFACE3D for topographic analysis of damage patterns
- Time-lapse Feature: Show forest recovery progress over time after storm events
Quantitative Analysis Features
Data Integration
- Field Validation Module: Allow foresters to upload ground-truth data to improve algorithm accuracy
- Integration with Weather Data: Correlate damage patterns with wind speed and direction data
- Automated Reporting: Generate PDF reports with statistics for affected forest management units
The implementation of these features would transform WINDWURF from a detection tool into a comprehensive forest storm damage management system, supporting the entire workflow from initial assessment to recovery planning.
👥 Team & Acknowledgments
Developed at Data Hackdays Bern with support from:
-
Swisstopo – Harmonized Sentinel-2 data - Tschoun,davidoesch
-
Amt für Wald und Naturgefahren (AWN) – Challenge owner nnjae, Dani Steinberger
-
Swiss Federal Office for the Environment (BAFU) -expert guidance Rdataflow, Yannick Barton
-
Eidg. Forschungsanstalt WSL and swisstopo – expert guidance and SAR Wrestling Marius Rüetschi
-
BFH Institut Public Sector Transformation - FullStack! holdan-8


Tous les participant-es, sponsors, partenaires, bénévoles et collaborateur-es de notre Hackdays sont tenus d'accepter le Hack Code of Conduct. Les organisateurs feront appliquer ce code tout au long de l'événement. Nous comptons sur la coopération de tous les participants* afin de garantir un environnement sûr pour tous. Pour plus de détails sur le déroulement de l'événement, veuillez consulter les directives sur notre wiki.
 Die Inhalte dieser Website stehen, sofern nicht anders angegeben, unter einer Creative Commons Attribution 4.0 International. / Sauf indication contraire, le contenu de ce site est placé sous Creative Commons Attribution 4.0 International.
Previous
Data Hackdays BE 2025
Next project